The game_frame sample, traced
game_frame is a mock game-engine
frame of ~30 systems - physics, animation, AI, audio, rendering and their neighbours - built on
Macrame's static task graph. Each system is a Guarded object; each node declares what
it reads and writes, and the schedule is derived from those declarations. The sample builds the
same frame in two variants from the same system bodies: a straightforward baseline, and an
optimised variant whose changes (snapshotting last frame's data, splitting the fattest
critical nodes, deferred staging) were all chosen by reading this trace.
The graph profiles itself. Running the sample with --trace executes a few hundred
frames and renders the average run - not one lucky frame - as the interactive SVG below.
If the tooltips don't respond, open the SVG in its own tab.
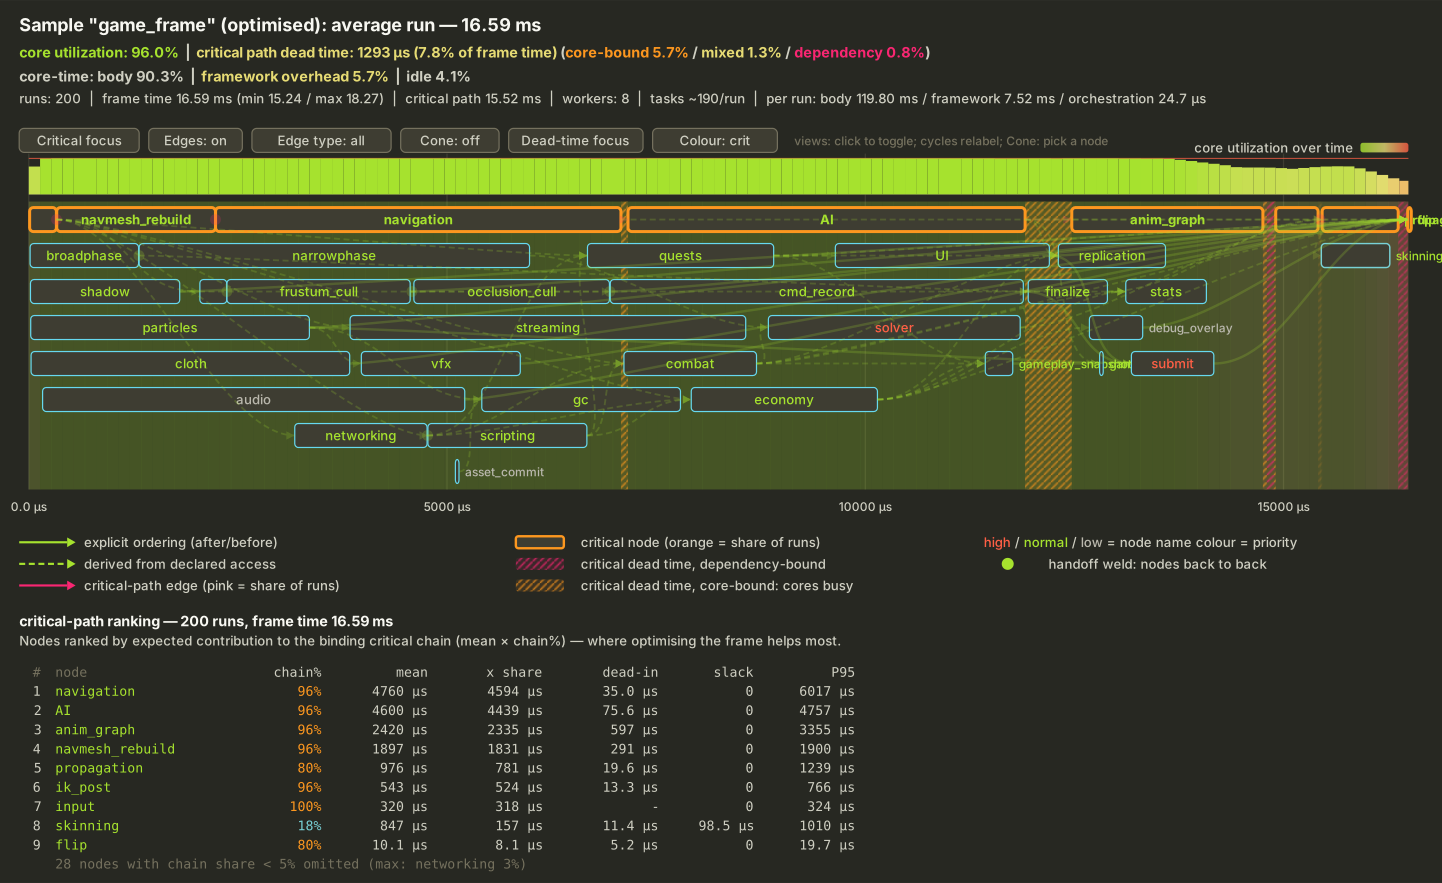
What you are looking at
The headline gives the verdict first: core utilization, critical-path dead time split by cause (core-bound / dependency-bound), and the core-time breakdown (body / framework overhead / idle). Below it, the frame: each bar is a node's median run, packed into rows that carry no thread identity - row occupancy over time is average concurrency. The band across the top shows core utilization over time.
- Orange-bordered nodes sit on the measured critical path; the border's share reflects how often the node bound the frame across runs.
- Hatched bands are critical dead time - places where the critical chain waited. Pink hatching means it waited on a dependency (a scheduling problem you can fix by cutting an edge); orange means the cores were simply busy (the frame is compute-bound).
- Edges: solid arrows are explicit ordering; dashed ones were derived from the declared data access. Pink edges carry the critical chain.
- The ranking table at the bottom orders nodes by expected contribution to the critical chain - the answer to "where does optimising help most".
How to use it
Hover any node for its stats (mean, P95, spread), its declared accesses, and its incoming and outgoing edges coloured by criticality. Hover highlights the incident edges. The buttons along the top toggle views: Critical focus dims everything off the chain, Dead-time focus isolates the waits, Cone restricts the view to one node's ancestors and descendants, and Edge type filters explicit versus derived edges.
The workflow the sample demonstrates: find the orange spine, check whether its dead time is
pink (cut the dependency - snapshot last frame's data, stage writes) or orange (split the fat
nodes so the work spreads), apply one lever, re-trace. The optimised variant of
game_frame is nothing more than a few iterations of that loop; the levers and their
measured effect are documented in the repo's
worked
optimisation example.